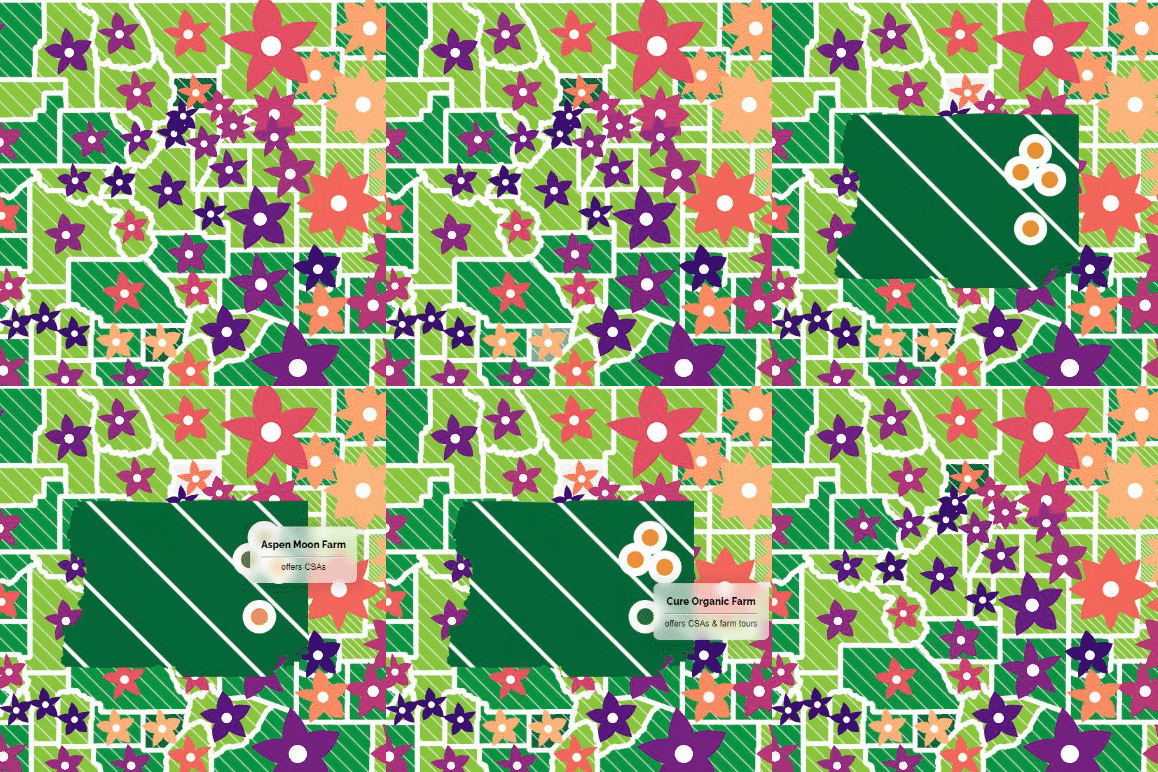
An filterable spreadsheet for locating BIPOC owned farms and ranchers by their location and product, paired with an interactive data visualization and web map highlighting the discrimination in our food systems.
The filterable spreadsheet contains data on farms and ranches that I have sourced that are minority-owned. Information includes the name, location, product, website, and social of each operation. Additional organizations and relevant links can be found on subsequent tabs. The sheet also links to a google form which can be used to add additional farms and ranches to the sheet. This was built with Google Sheets.
Click on the sheet to view the live database:
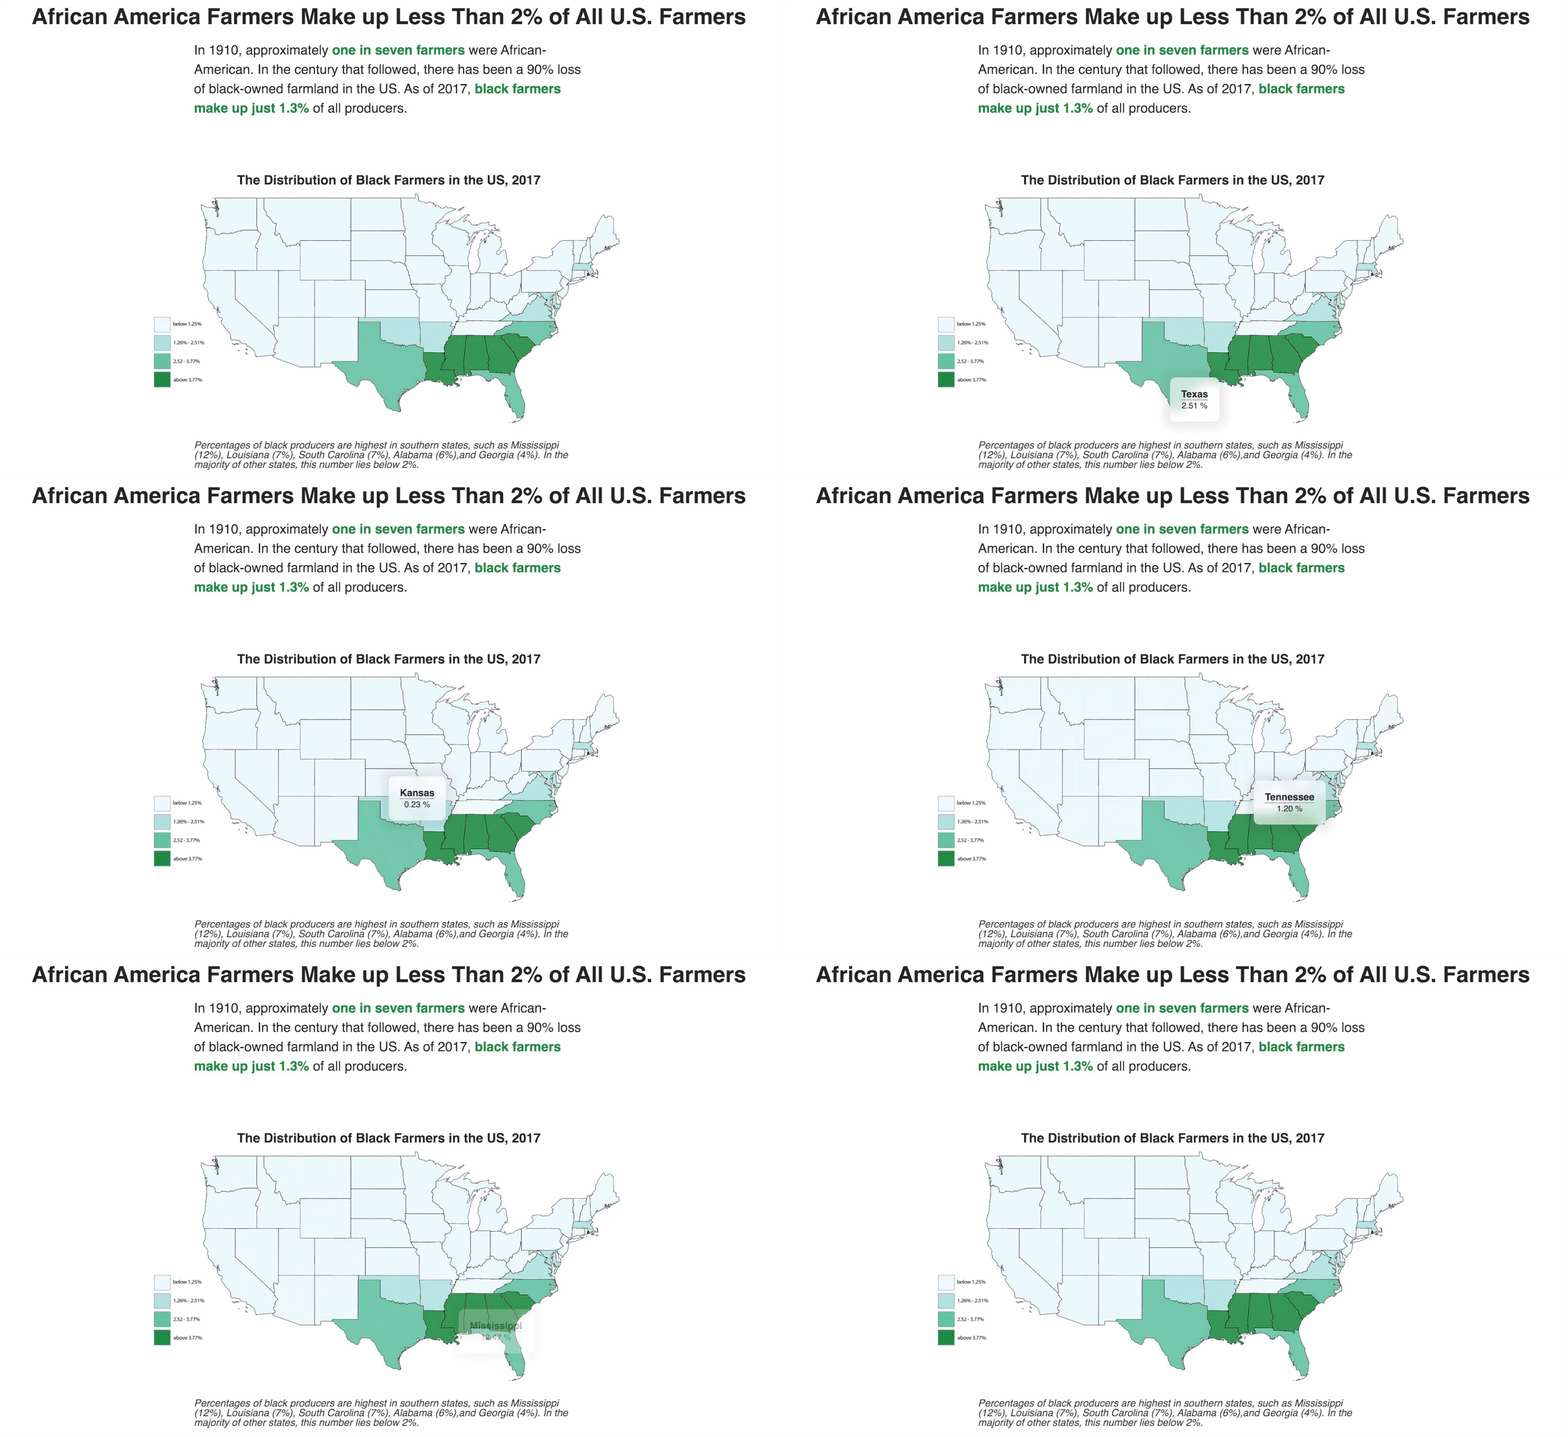
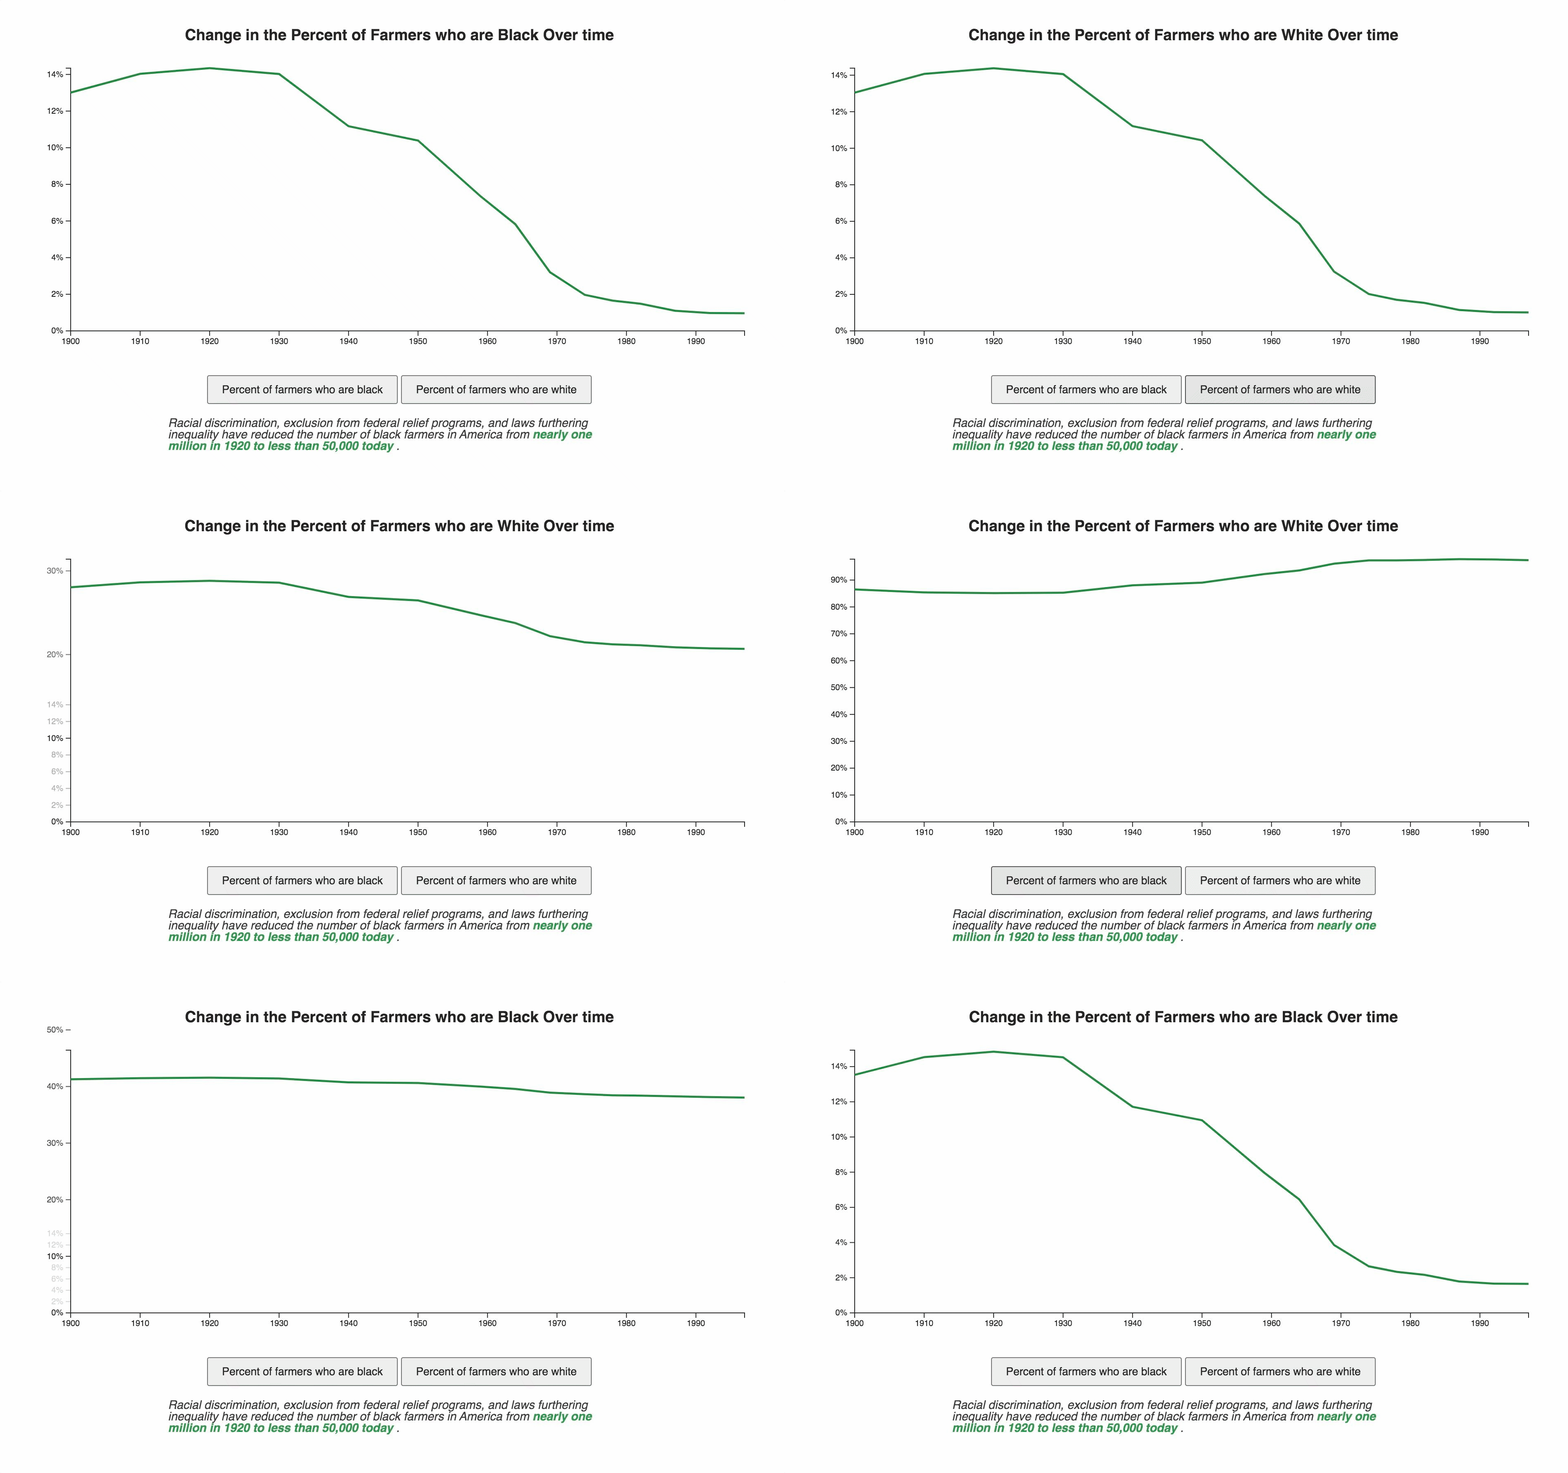
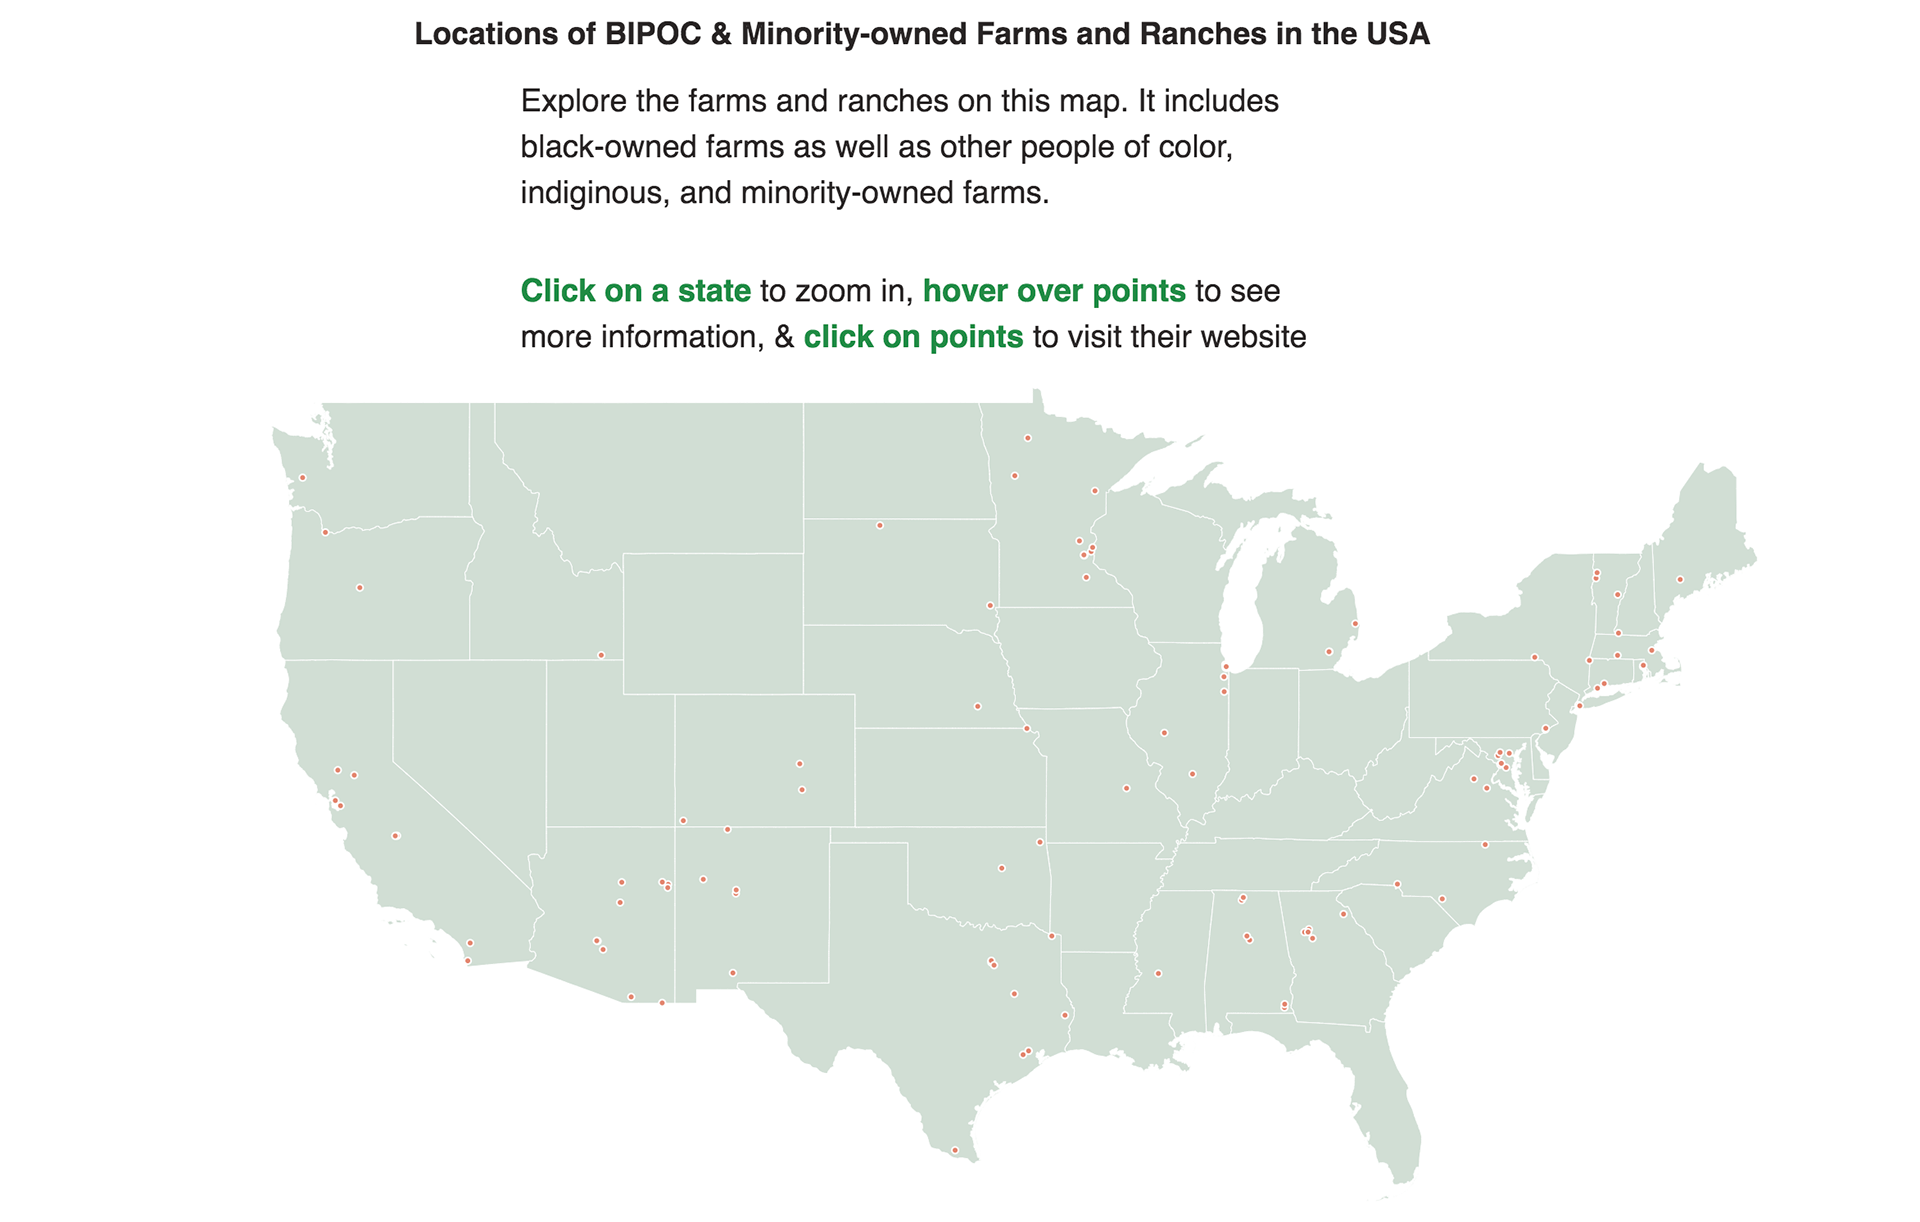
Associated with the databases is an interactive data visualization that explores the inequality in the US food system. The intent of this project is to provide a introduction to this issue and inform viewers using data from the USDA's Census of Agriculture. Included is an interactive map with the locations from the database, and additional resources for further learning. Some of the visualizations from the interactive webpage, desktop compatible only (for now). This project was built with d3.js, a data visualization library for javascript.
